When Monetary Networks Overtake Assets
A View of Wealth Across Time

We’re all pattern-recognition creatures. And the economist part of my brain (I think it’s there!) sees parts of the world in charts.
It’s not a line chart. It’s not a bar chart. It’s a mosaic — a set of rectangles sized by value, each competing for space.
A treemap.
When you build a treemap of global wealth, something becomes immediately clear.
The world is not evenly distributed.
Capital clusters. Dominance is visible.
I recently built three versions of this chart:
One for 1900
One for today (April 2026)
One projecting 2035, assuming Bitcoin reaches parity with gold
Placed side by side, they tell a story that’s hard to unsee.
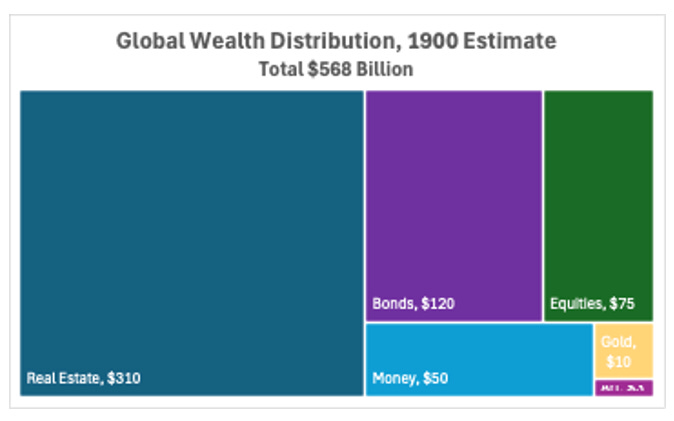
1900: The World Before Financialization
In 1900, the treemap is dominated by land and physical assets. Farmland and urban real estate are the dominant asset classes.
Financial assets exist, but they are secondary.
Gold is present — and important — but it is not abstracted into layers of derivatives, ETFs, and synthetic exposure. It is physical, held, and settled.
What stands out most is this: Wealth is local, tangible, and slow-moving.
If you’re a farmer in 1900, your balance sheet is land, equipment, animals, and stored commodities. Money exists, but it is not the dominant store of value — assets are.
The treemap reflects a world where value is tied directly to production and place.
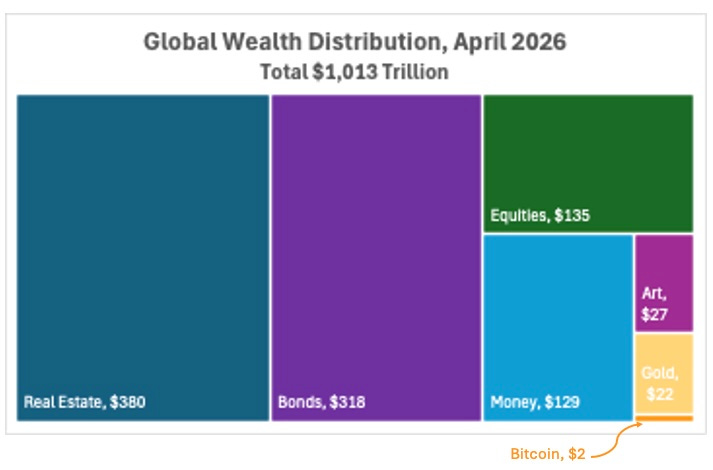
2026: The Financialized World
Fast forward to April 2026.
The treemap looks different.
Real estate is still significant, but 38% of global wealth instead of the 55% in 1900.
And bonds are now 31% of global wealth, up from 21% in 1900. Got debt?
Equities are the same proportion, 13%, as well as gold, 2%.
After having approximately doubled in price in the last year, gold reminds us of something important: The world already assigns enormous value to non-yielding monetary assets when they’re a store of value.
Gold produces no cash flow. It pays no dividend. It has storage costs.
And yet, it holds tens of trillions of dollars in value because it serves as a monetary anchor.
And farmland?
Still significant — often estimated in the $10–15 trillion range globally — but no longer dominant.
What changed?
Financialization.
Over the past century, capital moved away from purely physical assets into paper claims, yield-bearing instruments, and leveraged financial structures.
We shifted from:
Asset-based wealth → Financialized wealth
And now, something new is emerging.
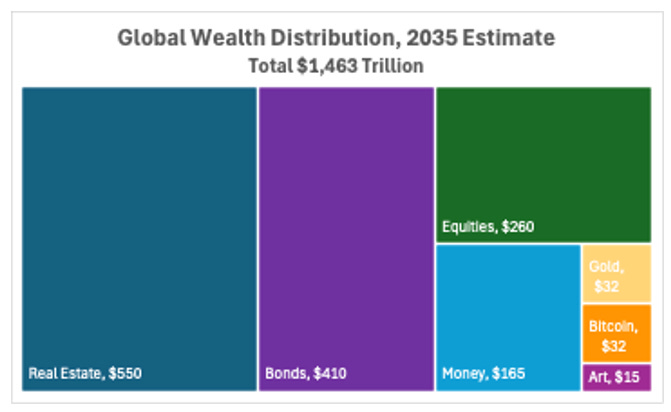
2035: When a Network Enters the Map
The third treemap projects a world where Bitcoin approaches gold equivalence. Michael Saylor of Strategy has predicted this happening by 2035, with $1.4 million Bitcoin. Analyst Cathie Wood has spoke in similar ways. And the Power Law Trend price for Bitcoin in 2035 is also $1.4 million.
Using the 2026 framework, that implies Bitcoin reaching on the order of $22 trillion.
This isn’t a prediction.
It is a scenario.
But it’s a powerful one.
Because when Bitcoin reaches that scale, it is no longer a niche asset, a speculative allocation, or a side bet. It becomes a monetary layer of global significance.
And the treemap changes accordingly.
A new rectangle emerges — comparable in size to gold.
Not a company.
Not a country.
A network.
Why This Is Different
Bitcoin is not just another asset class added to the chart.
It is fundamentally different. Bitcoin has no cash flows. There’s no central issuer. There’s no geographic anchor. There’s a fixed supply.
It behaves less like an asset and more like money emerging from a network.
And monetary networks don’t just sit alongside assets.
They absorb value from them.
Gold did this historically.
Fiat currencies did it within political systems.
Bitcoin will do it globally.
How Value Actually Moves
These transitions don’t happen all at once.
They happen through millions of individual decisions:
An individual holds 25% of savings in Bitcoin instead of cash
A commodity producer sells for Bitcoin instead of dollars
A business shifts treasury allocation away from short-term bonds
An investor shifts real estate exposure to Bitcoin
Each decision is individual.
But together, they reshape the system.
This is what your three treemaps capture:
1900 → Value anchored in land
2026 → Value anchored in financial assets
2035 (projection) → Value begins migrating into a monetary network
The Farmland Position
Farmland on the treemap is a part of the real estate rectangle. Mid-range estimates of global farmland value are $10 to $15 trillion, so ~ 2% to 3% of global real estate wealth.
Farmland is both a productive asset and a store of value.
But if a stronger monetary asset emerges, something subtle happens: Farmland may lose some of its monetary premium, not its productive value.
It still grows crops.
It still generates income.
Many people still want to own it, though fewer than before.
But capital may no longer flow into farmland primarily as a hedge against currency debasement.
That changes land pricing dynamics, land investment return expectations, and capital allocation across agriculture.
And importantly, it changes farmer behavior.
Farmers gain a new option: Store value in a global monetary network instead of solely in land or cash.
Case Study: Strategy
One of the most interesting real-time examples of this shift is MicroStrategy (MSTR), now re-branded as Strategy.
Founder Michael Saylor’s initial move in 2020 was simple in concept: Convert treasury dollars into Bitcoin.
Quoting Saylor from 2020:
“We are sitting on a melting ice cube. The cash is rapidly losing its purchasing power… We believe that Bitcoin is a dependable store of value and an attractive investment asset with more long-term appreciation potential than holding cash.”
“There’s $250 trillion worth of assets out there… When you expand the money supply, you’re effectively debasing all of those assets. If you’re holding cash, you’re guaranteed to lose purchasing power.”
But what’s followed is more interesting.
Strategy turned Bitcoin into digital capital.
Through convertible debt, equity issuance, and structured instruments, Strategy created a model where Bitcoin holdings support capital formation.
At times, this has enabled them to effectively generate double-digit returns in dollar terms through financial structuring.
This is new.
A monetary asset being used as a base layer for capital markets.
As an example, one of Strategy’s creations is Strike (STRK), an 8% convertible preferred. It pays an 8% dividend and is convertible into common equity. They have higher yielding alternatives, but this one offers upside in the equity. And where else will you find 8%? And it has tax advantages too.
There are retirees happy to put part of their nest egg in this to produce regular cash and keep their equity value growing in the longer-term. And what do those retirees need to understand about Bitcoin? Zero.
Strategy now holds 762,099 Bitcoin ($51 billion), about 3.6% of the total supply.
That’s a high-profile way that Bitcoin has begun to absorb dollar value.

Signals Beyond the Headline
Strategy is a visible example, but the pattern runs deeper.
Firms adding Bitcoin to treasury reserves
Payment rails like Strike enabling instant settlement
Financial platforms like Block integrating Bitcoin into broader systems
Early-stage Bitcoin-collateralized lending models
These are early.
Fragmented.
But directional.
Capital markets are beginning to reorganize around a monetary network.
As near as I can tell, the cheapest interest rates in the world today are where borrowers use Bitcoin as collateral. These mostly decentralized capital markets that aren’t on the radar of most. But they will be soon enough.
By the way, Fannie Mae recently backed a new crypto-backed mortgage product from Better Home & Finance and Coinbase where home mortgage borrowers can pledge Bitcoin (or USDC) as collateral to help fund a down payment on a home — without selling it.

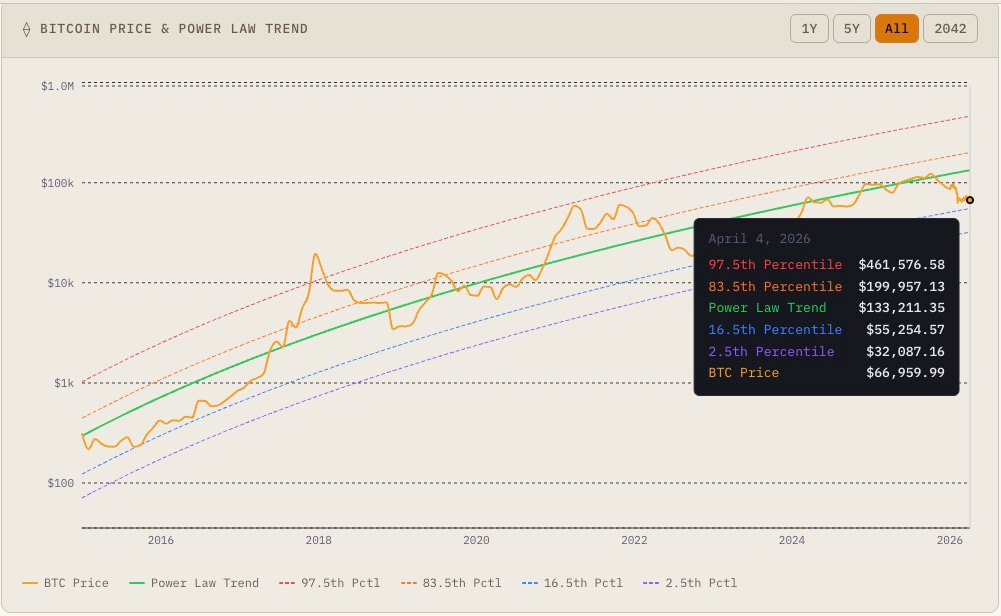
Power Law vs. Structural Collapse
Not all growth paths are equal.
Traditional financial assets often follow exponential growth, driven by credit expansion, monetary policy, and leverage.
These systems can appear stable — until they break.
I saw this in 1996 working as a consultant for Eastman Kodak.
Kodak was considered one of the safest companies in the world.
But the underlying structure was failing.
Digital photography replaced film.
Within a decade, the company collapsed.
Kodak stock, a traditional financial asset, didn’t just become volatile.
It went nearly to zero.
That’s the volatility that matters: Structural decay disguised as stability.
Power law systems behave differently.
They are volatile early.
But as networks grow participation broadens, liquidity deepens, and volatility (relative to size) declines.
They don’t typically go to zero.
They evolve into infrastructure.
What Treemaps Really Show
The power of the treemap charts isn’t precision.
It’s perspective.
They show a world where wealth was once anchored in land is now a world dominated by financial assets. And a future world where a monetary network claims an increasing share of global value.
At $22 trillion, gold already proves that non-yielding monetary assets can dominate balance sheets.
The leap to Bitcoin is not about whether that category exists.
It already does.
The question is how fast Bitcoin begins to share or take that role.
What This Means for Agriculture
Agriculture has always adapted to infrastructure shifts. Railroads expanded market access in the nineteenth century. Telegraphs and eventually telephones improved price discovery. And eventually the internet reshaped information flow and logistics.
If Bitcoin becomes a monetary layer, agriculture faces a similar moment.
Not whether to speculate.
But whether to participate early.
Because early participation changes positioning:
Holding some reserves in Bitcoin
Settling transactions differently
Accessing global capital more directly
And if adoption happens in networks of farmers and agribusinesses, the effect compounds.
Networks strengthen networks.
The Long Look
Treemaps are snapshots.
The long look is about movement.
Value migrates toward what preserves it best.
From land…
To financial assets…
To monetary networks.
No transition is smooth.
No model is perfect.
But the mechanism is consistent: Individuals making decisions about where to store value.
One decision at a time.
If Bitcoin continues on its current trajectory, your 2035 treemap will not feel speculative.
It will feel inevitable.
And the real question becomes:
Where were you positioned as the map was being redrawn?
I’m thrilled to be a part of the Iowa Startup Collective, a group of writers exploring entrepreneurship. Please check out the Roundup of columns.