
Two weeks ago, I published The Corn-Bitcoin Power Law, finding that the number of bushels of corn required to buy one Bitcoin follows a power law with an exponent of 5.03 and an R² of 0.91 over thirteen years of daily data.
That piece drew more attention than I expected. But the most interesting question it raised wasn’t about corn at all.
In the original analysis, I noted that corn’s power law exponent — 5.03 — was close to the Gold-Bitcoin exponent identified by Stephen Perrenod in his work on Bitcoin priced in gold ounces: 5.22. I suggested that this similarity might mean something important. That Bitcoin wasn’t just outperforming corn at a predictable rate, but outperforming commodities generally at a predictable rate. That the specific commodity you use as a yardstick might barely matter.
That was a claim. I decided to run another test.
The Question
One commodity matching gold’s power law exponent could be a coincidence. The exponents are close — 5.03 versus 5.22 — but close isn’t conclusive. Corn and gold are fundamentally different assets with different supply dynamics, different demand drivers, and different roles in the global economy. Their similar exponents might reflect a shared structural relationship with Bitcoin, or they might just reflect the fact that both have been roughly stable in dollar terms while Bitcoin appreciated rapidly.
To distinguish between these explanations, you need more data points. If Bitcoin’s power law structure is truly endogenous — if it reflects something about Bitcoin’s own network dynamics rather than something about the assets you’re measuring it against — then the exponent should hold across a wider range of commodities. Not just one grain. Not just one monetary metal. But across assets with fundamentally different supply curves, demand structures, and price dynamics.
Test
I applied Perrenod’s methodology to four additional commodities: soybeans, wheat, crude oil, and copper. Each was chosen because it represents a different kind of physical asset:
Soybeans — a second major grain, closely related to corn but with distinct demand drivers (protein meal, vegetable oil, biodiesel). If the corn result were an artifact of corn-specific dynamics, soybeans should deviate.
Wheat — the world’s most widely consumed grain, with supply dynamics more sensitive to geopolitics and weather than to U.S. farm policy. Different enough from corn and soybeans to be informative.
Crude oil (WTI) — an energy commodity, not a grain. Its price is driven by geopolitics, OPEC decisions, energy transitions, and macroeconomic cycles. It has no biological growing season, no yield curve, no planting intentions. About as different from corn as a commodity can be.
Copper — an industrial metal, sometimes called “Dr. Copper” for its reputation as a barometer of economic health. Driven by construction, electrification, and manufacturing. No monetary premium, no agricultural connection, no energy arbitrage. A pure industrial signal.
For each, I calculated the monthly commodity-per-Bitcoin ratio — bushels, barrels, or pounds per Bitcoin — from April 2013 through May 2026. Then I regressed the log of each ratio against the log of Bitcoin’s age in days, exactly as Perrenod did with gold and as I did with corn.
Note that I didn’t use as big a dataset for this analysis. The Corn-Bitcoin Power Law analysis used 3,907 daily observations from CBOT futures — a dense, granular dataset that supports a high-confidence regression. For this broader test, I used monthly commodity prices from the World Bank’s commodity price database (via FRED), giving us 158 monthly observations per commodity. That’s substantially fewer data points. I chose this source because it provides consistent, apples-to-apples pricing across all five commodities from a single methodology — the right tradeoff for a cross-commodity comparison, even at the cost of granularity. As a sanity check: the corn exponent on this monthly data comes in at 4.99 versus 5.03 on the daily CBOT data. Different source, different frequency, essentially the same answer. But the monthly results should be read as directionally strong, not as carrying the same statistical weight as the daily corn analysis.
If the exponents scatter — if soybeans land at 3 and copper at 7 — then the corn-gold similarity was a coincidence. The structure would be in the measuring sticks, not in Bitcoin.
If they cluster, the implication is much stronger.
The Finding
They cluster.
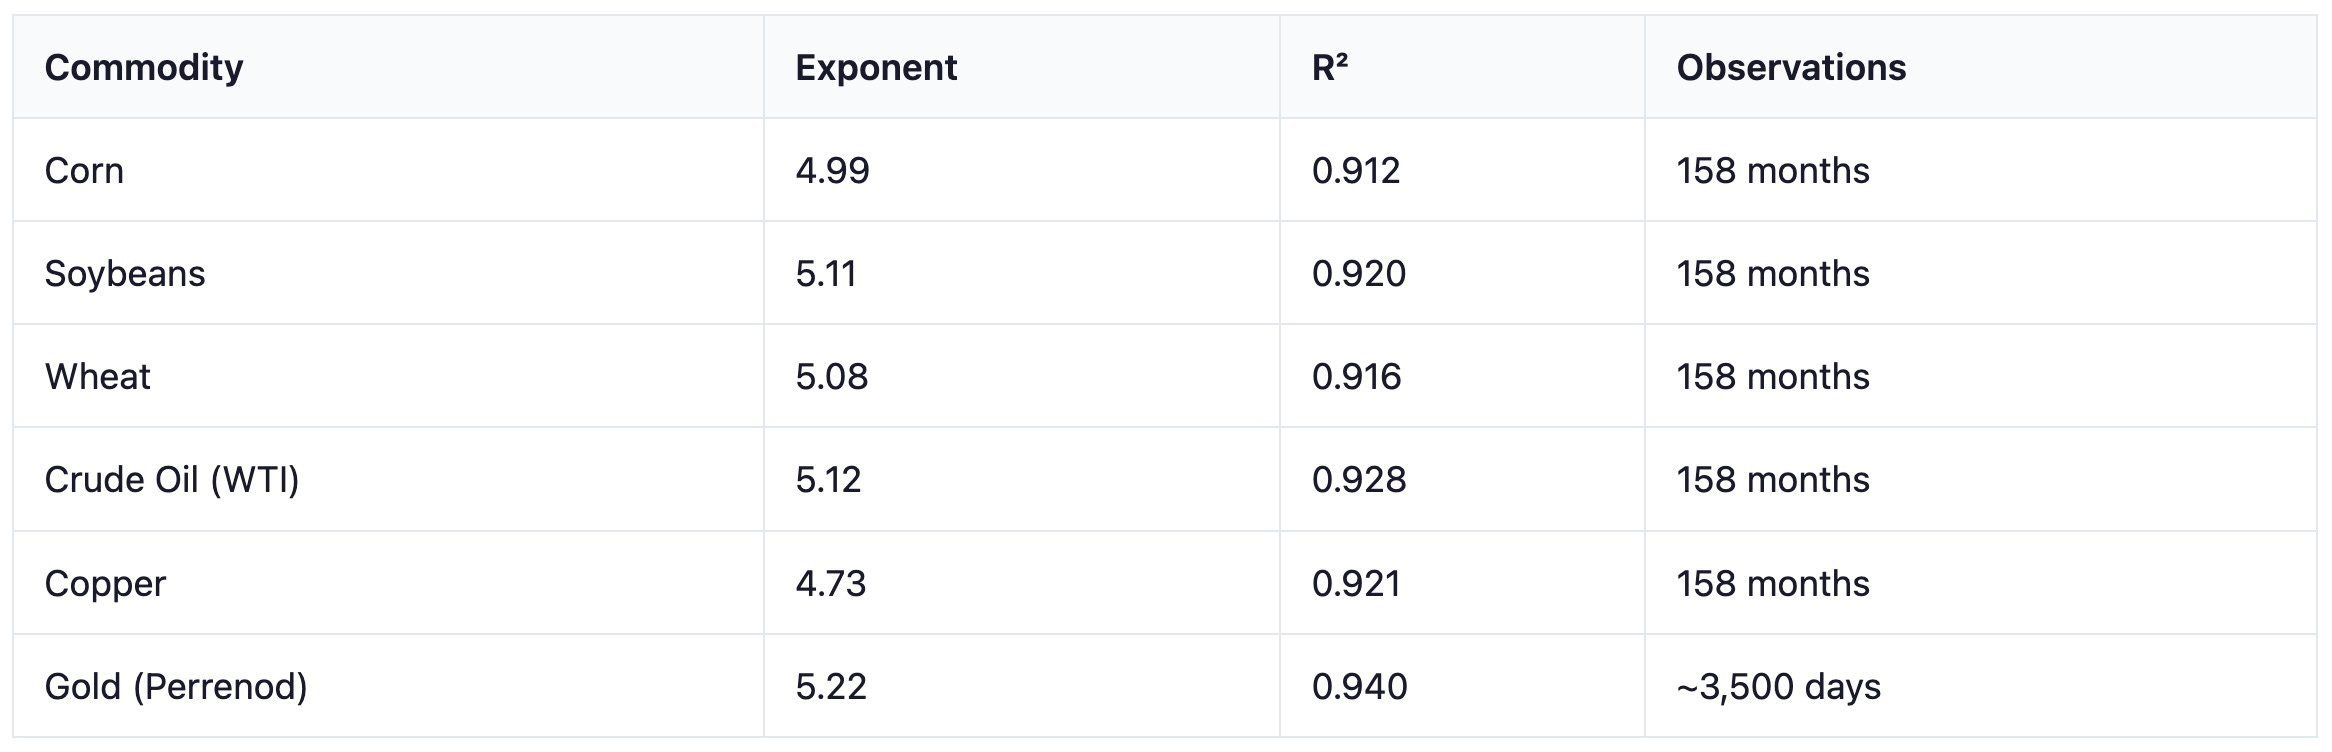
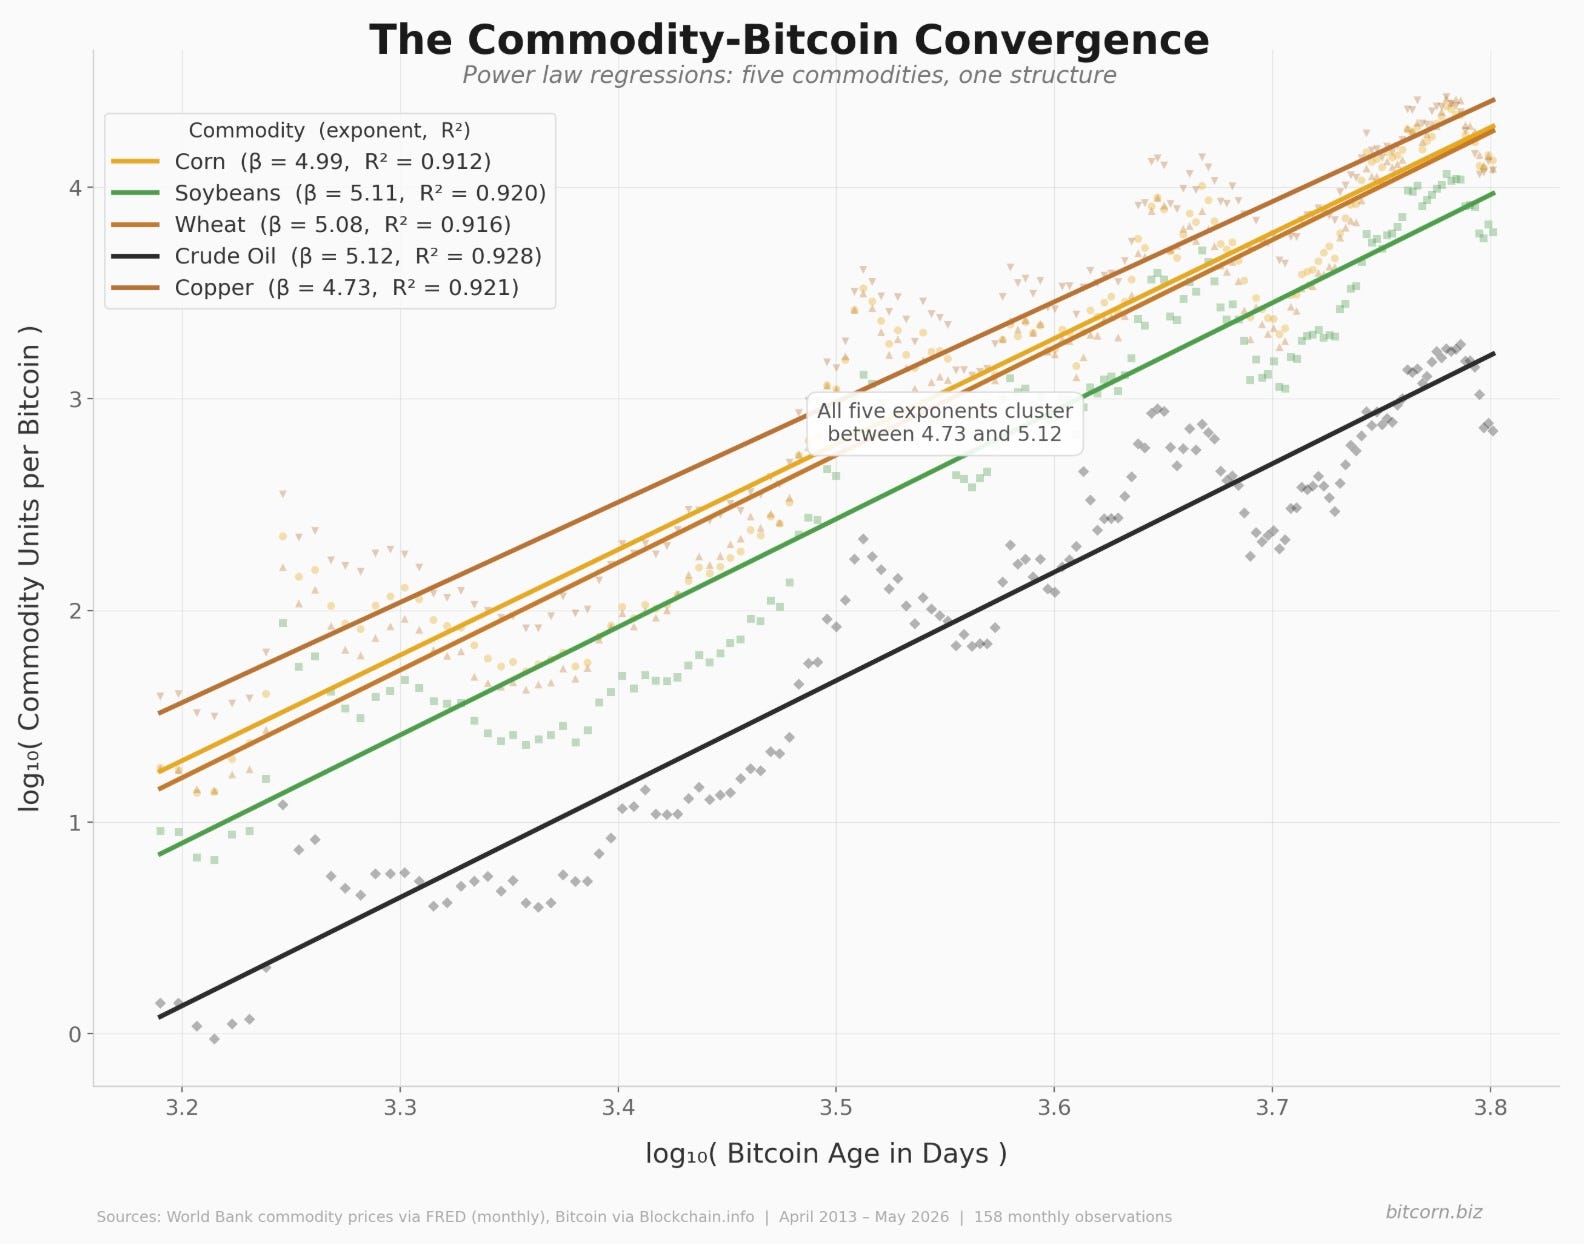
Six physically distinct assets — three grains, an energy commodity, an industrial metal, and a monetary metal — all follow power laws against Bitcoin with exponents clustering around 5.0.
The mean exponent across all six is 5.04. The standard deviation is 0.15. The total spread — from copper at 4.73 to gold at 5.22 — is less than half a unit.
Every R² is above 0.91. The weakest fit (corn, at 0.912) still explains more than 91% of the variance. The strongest (gold, at 0.940) explains 94%.
This is not a loose pattern. It is a tight mathematical regularity across assets that share almost nothing in common except one thing: they are all physical commodities being measured against Bitcoin.
Independent Confirmation
I’m not the only one finding, commenting, or writing about this.
Shortly after the Corn-Bitcoin Power Law was published, I got an X reply from @1blue3brown. The post pointed to the Bitcoin Power Law Lens dashboard with commodity-Bitcoin power law results, calculated independently using different data sources and methodology:
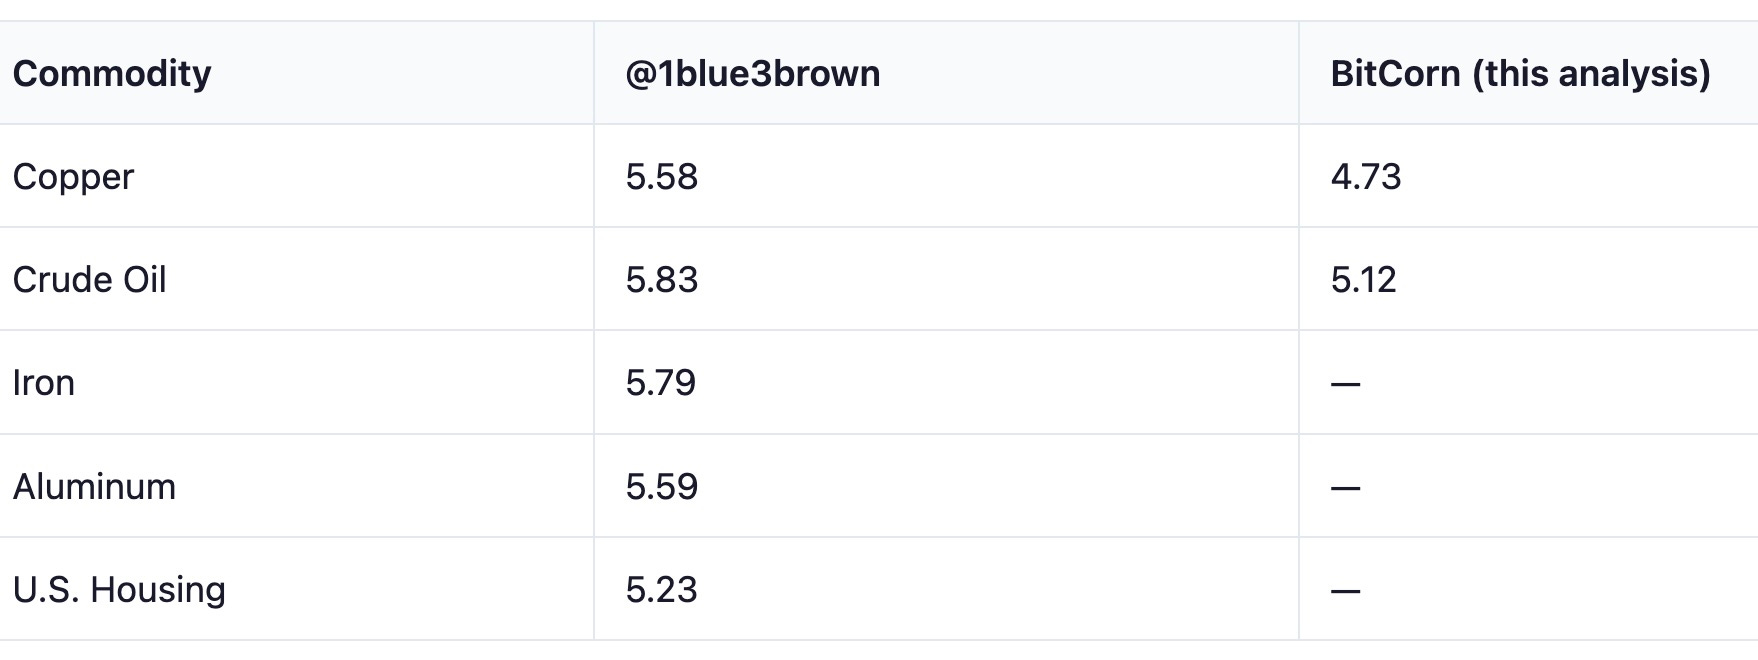
His exponents run higher than mine for this analysis — clustering around 5.6 rather than 5.0. The difference almost certainly reflects methodology: different price sources, different start dates, different handling of early Bitcoin data, and likely daily rather than monthly frequency. His R² on the base Bitcoin model is above 96%, suggesting a denser dataset.
But the structural finding is identical. His five assets cluster. Our five assets cluster. Perrenod’s gold sits right in the range. Three independent analysts using different data, different methodologies, and different commodities all arrive at the same conclusion: commodity-Bitcoin ratios follow power laws with exponents that converge.
The exact exponent depends on your data and methods, but by all appearances the numbers will be anywhere from roughly 4.7 to 5.8. The convergence doesn’t depend on your data and methods. That’s the finding.
His dashboard also extends the analysis to assets I hadn’t seen prior. For example, iron, aluminum, and U.S. housing. The industrial metals (iron at 5.79, aluminum at 5.59) cluster tightly with his copper result, which makes sense: they’re driven by similar industrial demand forces. U.S. housing at 5.23 is particularly interesting because housing, like gold, carries a monetary premium — people buy houses partly as stores of value. And housing’s exponent (5.23) lands almost exactly on gold’s (5.22). Assets with monetary premiums may produce systematically higher exponents than pure commodities, a question worth further study.
I’d encourage anyone interested in exploring these relationships interactively to visit bitcoinpowerlens.streamlit.app. It’s an interesting tool.
Why This Matters
What does this findings say? What does it not say?
It does not say that corn, soybeans, wheat, oil, and copper are interchangeable. Obviously they aren’t. Each has its own supply curve, demand structure, seasonal pattern, and price dynamics. Corn responds to Iowa weather and Chinese import demand. Oil responds to OPEC and the Strait of Hormuz. Copper responds to AI data center construction and EV production. These assets move for entirely different reasons on any given day.
What it does say is that when you measure any of these assets against Bitcoin, the same mathematical structure emerges. The ratio of commodity-units-per-Bitcoin falls along a power law with an exponent in the neighborhood of five, regardless of which commodity you choose, which data source you use, or who runs the analysis.
The implication is that the power law is not describing something about corn, or oil, or gold. It is describing something about Bitcoin.
Specifically: Bitcoin’s purchasing power, measured against the physical economy, grows as a function of its age raised to approximately the fifth power. The exponent is a property of Bitcoin’s network — its adoption dynamics, its scale-invariant growth, its self-organizing structure. The commodity you denominate it in is just a measuring stick. And the measuring stick barely changes the answer.
This is a stronger statement than the one I wrote two weeks ago. In the Corn-Bitcoin piece, I showed that corn follows a similar power law as gold. That was suggestive. Now — with results across five commodities, Perrenod’s gold, and @1blue3brown’s independent confirmation across five more — the case is more structural than suggestive.
What the Variation Tells Us
The exponents aren’t identical. They cluster, but they don’t collapse to a single number. The variation is small — but it’s real, and it’s informative.
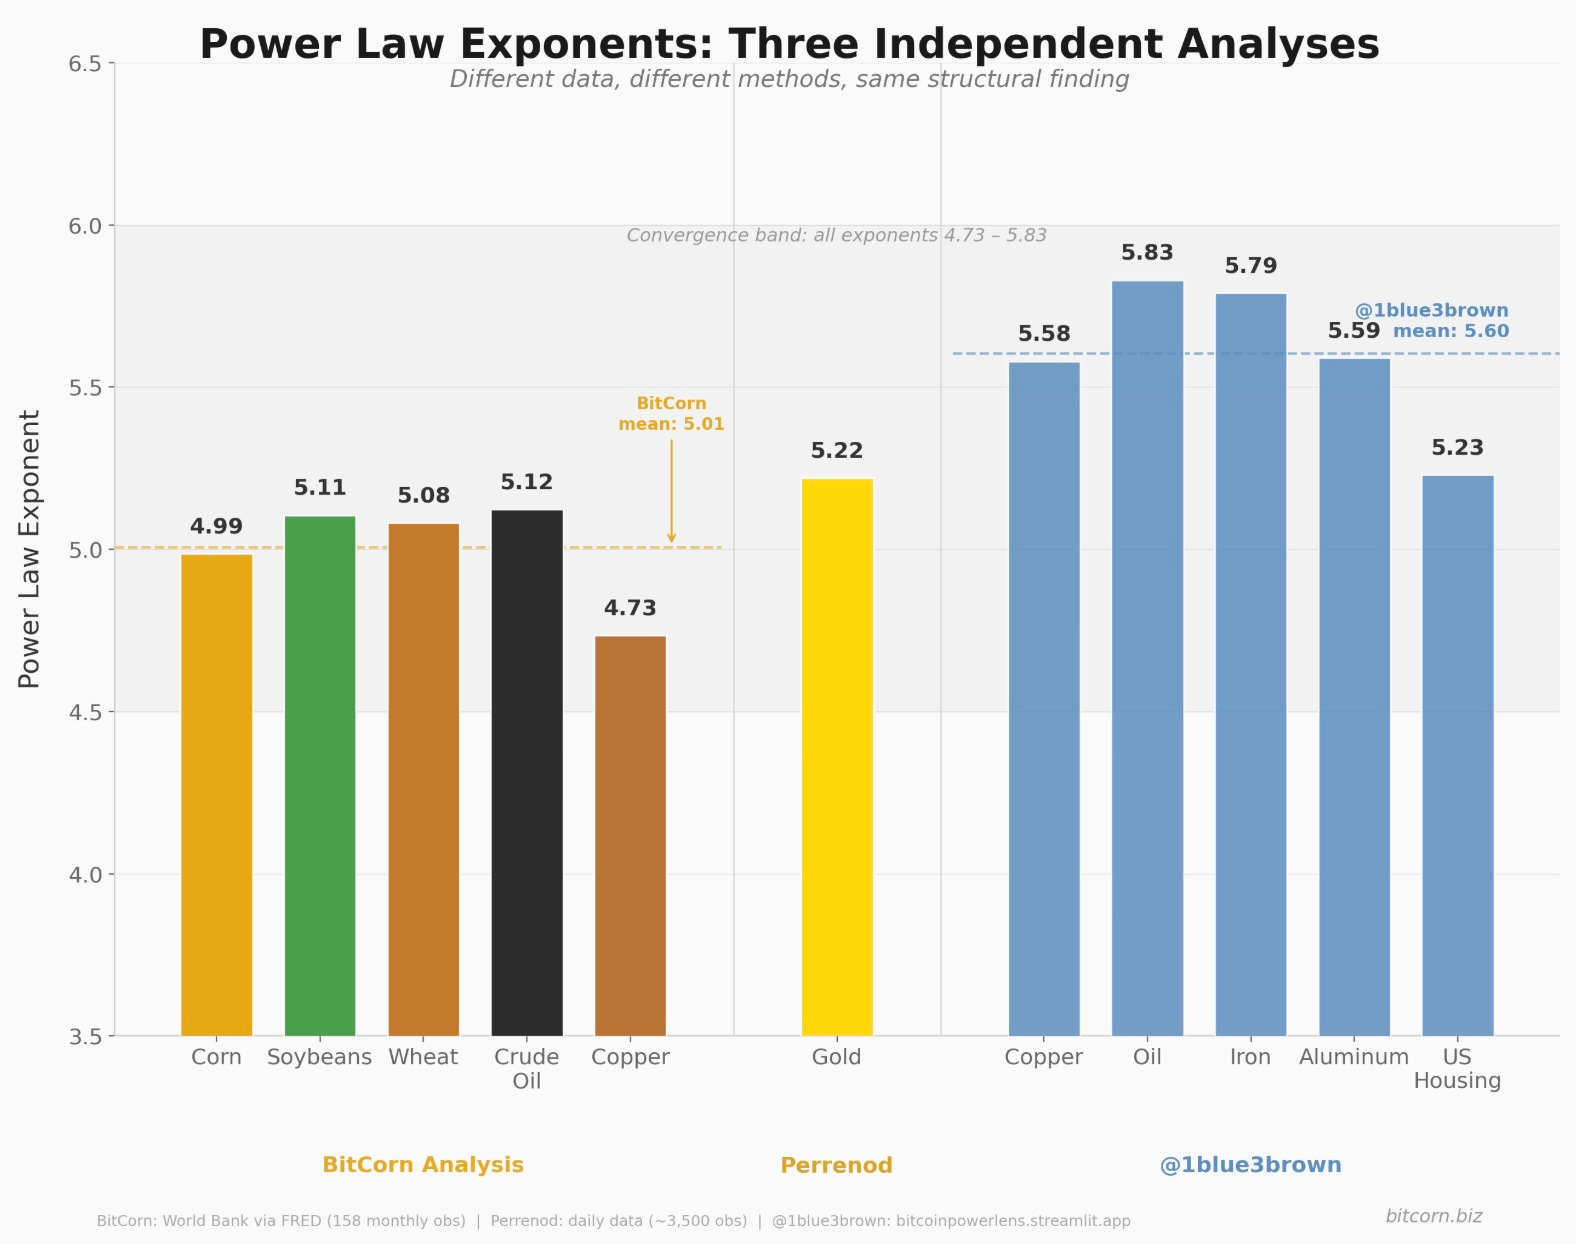
The ordering makes sense. Gold has a relatively high exponent (5.22) because gold appreciated modestly in dollar terms over this period — roughly 7-8% annually. The power law exponent captures Bitcoin’s appreciation relative to the commodity, so an asset that appreciates in dollars produces a slightly higher exponent. Gold’s monetary premium gives it a structural upward drift that corn, wheat, and soybeans don’t have.
The grains sit in the middle — corn at 4.99, wheat at 5.08, soybeans at 5.11 — reflecting their roughly flat-to-slightly-declining real dollar prices over the period. Crude oil (5.12) lands near the grains despite being a fundamentally different asset, because oil’s dollar price, while volatile, has been roughly trendless over thirteen years.
Copper has the lowest exponent in our analysis (4.73) — and this is interesting. Copper is currently at record highs, driven by the structural demand from AI infrastructure, electrification, and industrial re-shoring. Its strong dollar-price appreciation over the period pulls the exponent down relative to the others. In a sense, copper’s lower exponent is evidence that the framework works: the exponent correctly reflects the fact that copper has been a strong performer in dollar terms, which means Bitcoin has had to work slightly harder to outpace it.
The gap between exponents is, almost exactly, the difference in each commodity’s own dollar-price trajectory. Strip that out — as Perrenod does by measuring in non-dollar units — and you’d expect the exponents to converge even further. The remaining spread reflects each commodity’s real performance against the dollar. The underlying Bitcoin absorption rate is the same.
The Z-Scores: Where the Opportunities Are
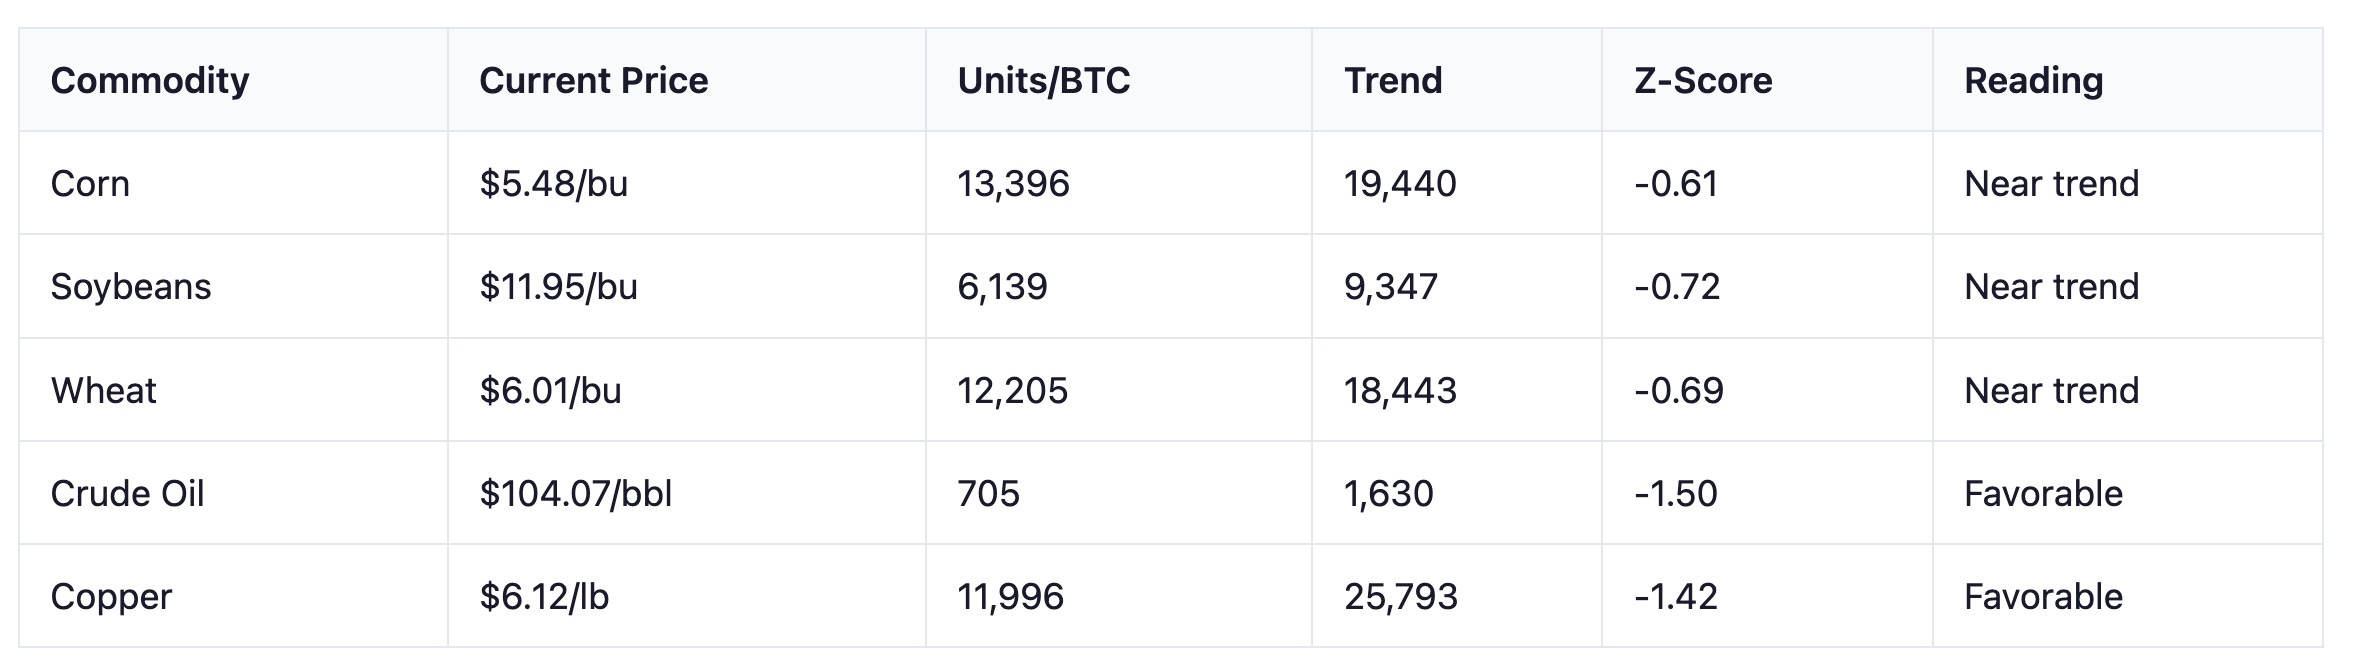
Just as the Corn-Bitcoin Z-score tells you whether corn is temporarily “cheap” or “expensive” in Bitcoin terms, the same framework applies to every commodity in this analysis.
Bitcoin at approximately $73,400 | Data through May 2026
The grains are all modestly below trend — Z-scores around -0.6 to -0.7. Slightly favorable for anyone converting grain revenue to Bitcoin, but nothing extreme. Within the normal ±1σ band.
Crude oil and copper are a different story. Both show Z-scores beyond -1.4, meaning they are significantly “expensive” in Bitcoin terms right now — the power law model says you’re getting substantially more barrels or pounds per Bitcoin than the structural trend predicts.
This makes intuitive sense. Oil prices have been elevated by geopolitical disruption. Copper is at record highs driven by AI infrastructure and electrification demand. Both commodities have surged in dollar terms, which pushes their Bitcoin ratios below the power law trend. The Z-score is correctly identifying a moment when the physical economy — energy and industrial metals specifically — is temporarily overpriced relative to Bitcoin’s structural trajectory.
For anyone in the oil or metals business thinking about Bitcoin exposure, the Z-scores are saying: the terms of trade are unusually favorable right now. That window won’t stay open forever.
What This Means for Agriculture
The Corn-Bitcoin Power Law was an agricultural finding with broader implications. The convergence is a broader finding with agricultural implications.
If Bitcoin absorbs purchasing power from all physical commodities at approximately the same structural rate, then the case for Bitcoin in agriculture isn’t about just corn. It’s about every input, every output, and every commodity that touches the agricultural supply chain.
Consider what a diversified agricultural operation actually buys and sells:
Revenue comes from grains — corn, soybeans, wheat. All three follow the power law at exponents near 5.
Input costs include energy (diesel, natural gas, propane) and industrial materials. Crude oil follows the power law at 5.12. Copper — which proxies for industrial commodity inflation broadly — follows at 4.73.
Financial reserves historically sit in land and, for some operations, gold. Gold follows at 5.22. Housing, if at all approximating farmland — the other major real asset agricultural families hold — follows at 5.23 on @1blue3brown’s data.
Every major commodity in the agricultural value chain — the things you sell, the things you buy, and the things you save in — is losing purchasing power against Bitcoin at approximately the same structural rate. The T⁵ relationship isn’t a corn phenomenon. It’s a commodity phenomenon.
This reframes the BitCorn thesis. We started by asking whether there are better and worse times to convert corn revenue into Bitcoin. The answer is yes — the Z-score framework helps with timing. But the Convergence finding says something larger: the structural case for Bitcoin applies not just to grain producers, but to every business that operates in the physical commodity economy.
Elevators, processors, fertilizer dealers, equipment manufacturers, energy producers, grain merchandisers, livestock operations — every business whose revenues and costs are denominated in physical commodities faces the same mathematical reality. Bitcoin’s purchasing power, measured against the goods these businesses trade in, grows at T⁵. The specific commodity doesn’t change the conclusion.
For agricultural families thinking in generational terms — and most do — the question sharpens. It’s no longer “should we convert some corn revenue to Bitcoin?” It’s “should we convert some of our commodity-denominated economic activity to Bitcoin?” The answer the power law gives, across six different assets and three independent analyses, is the same.
The Bottom Line
Six commodities — corn, soybeans, wheat, crude oil, copper, and gold — all follow power laws against Bitcoin with exponents clustering around 5.0 and R² values above 0.91. An independent analysis by @1blue3brown confirms the pattern across five additional assets, with exponents clustering around 5.6. The precise exponent depends on data and methodology. The convergence does not.
This is not about corn. It’s not about gold. It’s about Bitcoin.
Bitcoin’s purchasing power, measured against the physical economy, grows as a function of its network age raised to approximately the fifth power. It does this regardless of whether you measure in bushels, barrels, pounds, or ounces. The structure is scale-invariant — the mathematical signature of a self-organizing network absorbing value from the broader economy at a rate that does not depend on what you’re measuring it against.
For those of us in agriculture, the practical takeaway is both simple and profound: the structural case for converting commodity revenue into Bitcoin is not specific to any single crop, any single commodity, or any single link in the supply chain. It applies to the entire physical economy. And it applies with a mathematical consistency that, after thirteen years and across multiple independent analyses, is increasingly difficult to dismiss as coincidence.
I write this as Bitcoin trades in the $60K’s, substantially off its October all time high of $126K. This too shall pass.
The power law is in Bitcoin. The opportunity is in recognizing it.
This article extends the analysis from The Corn-Bitcoin Power Law (June 12, 2026) and builds on Stephen Perrenod's Gold-Bitcoin power law research. The commodity prices used were World Bank via FRED (158 monthly observations). Bitcoin prices were from Blockchain.info. Gold values from Perrenod (2026, ~3,500 daily observations). @1blue3brown's results from Bitcoin Power Law Lens (bitcoinpowerlens.streamlit.app). Original Corn-Bitcoin Power Law: 3,907 daily CBOT observations. This is analytical research, not investment or financial advice.
I’m thrilled to be a part of the Iowa Startup Collective, a group of writers exploring entrepreneurship. Please check out the Roundup of columns.