Deep Dive — Copper, Commodity Supercycles, and Agriculture
What the Real Economy Is Telling Us That Gold Didn't

In January, in Deep Dive – Gold, Silver, and Agriculture, I wrote about the relationship between precious metals and agricultural commodities. Gold was near $5,000 an ounce. Silver had traded above $100. The question on many minds was whether agriculture was next — whether the surge in monetary metals signaled an imminent repricing of corn, soybeans, and wheat.
My January conclusion was skeptical. The base case for a broad agricultural repricing was weak. Supply was ample. Energy was restraining cost pressures. Biofuel-driven demand growth had matured. And gold’s signal appeared to be fundamentally financial — reflecting central bank purchases, sovereign debt concerns, and geopolitical hedging — not the kind of physical scarcity that historically pulls commodity prices higher together.
Part of the love-hate relationship anyone dealing with markets is that things don’t change much. Until they do.
Four months later. Surprise! The world’s changed. I was partly right and partly wrong — but not in the way I might have expected.
I’ll briefly revisit gold, silver, and energy, but introduce a new commodity to the mix, copper.
There always risk of shiny object syndrome for me. But copper’s getting shiny now.
Welcome Dr. Copper.
What Happened to Gold and Silver
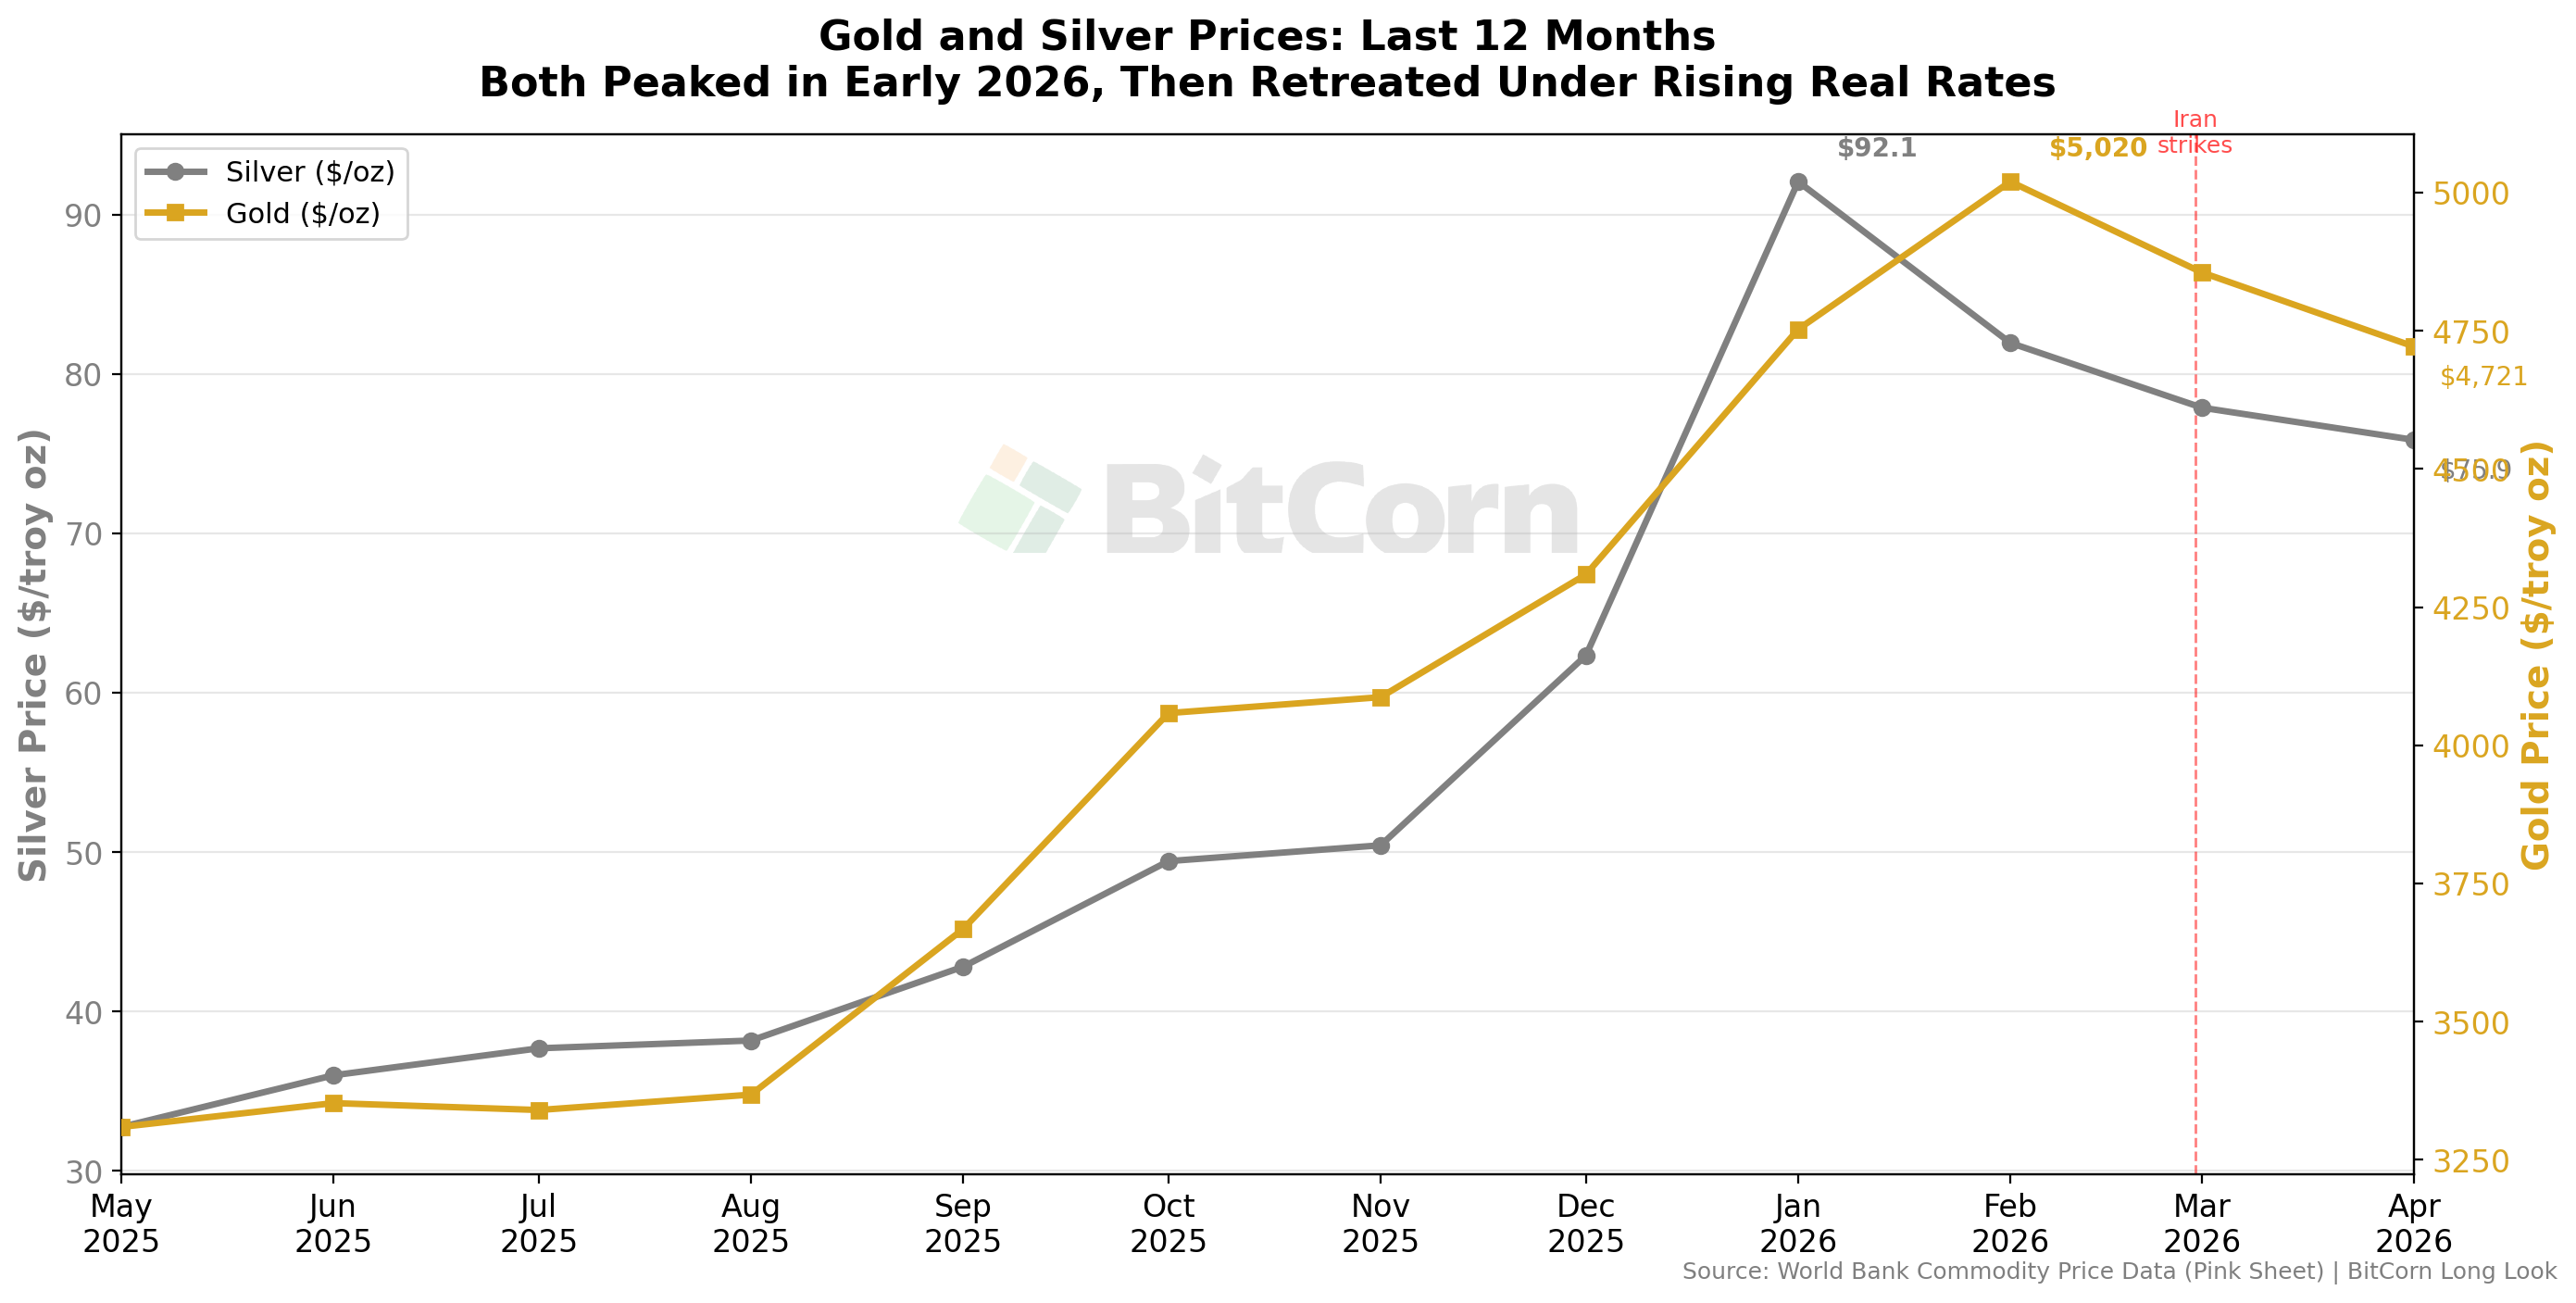
Gold’s fallen roughly 10% since January, trading near $4,500. Silver has dropped about 25%, back into the mid-$70s. This decline occurred during a period that included an actual shooting war involving Iran, the effective closure of the Strait of Hormuz, and the largest energy supply disruption in decades.
That last point deserves emphasis. Gold and silver — the classic crisis hedges — declined during a genuine geopolitical crisis. Why? Partly because the Federal Reserve, now under Chair Kevin Warsh, responded to the inflationary impulse of surging oil prices with a hawkish posture. Real interest rates rose 40 to 50 basis points. The 10-year TIPS yield climbed above 2.1%. In a regime of rising real rates, gold faces a gravitational pull downward regardless of what is happening in the physical world.
This is exactly the distinction I drew in January. Gold’s signal was financial. The physical commodity world was telling a different story entirely.
The Energy Channel — Activated
In the January article, I identified energy as the strongest cross-commodity transmission channel from broader commodity inflation to agriculture. Oil prices affect fertilizer production costs, fuel and drying expenses, and transportation. I argued that this channel was dormant — that U.S. energy abundance and the administration’s commitment to lower energy costs were keeping it suppressed.
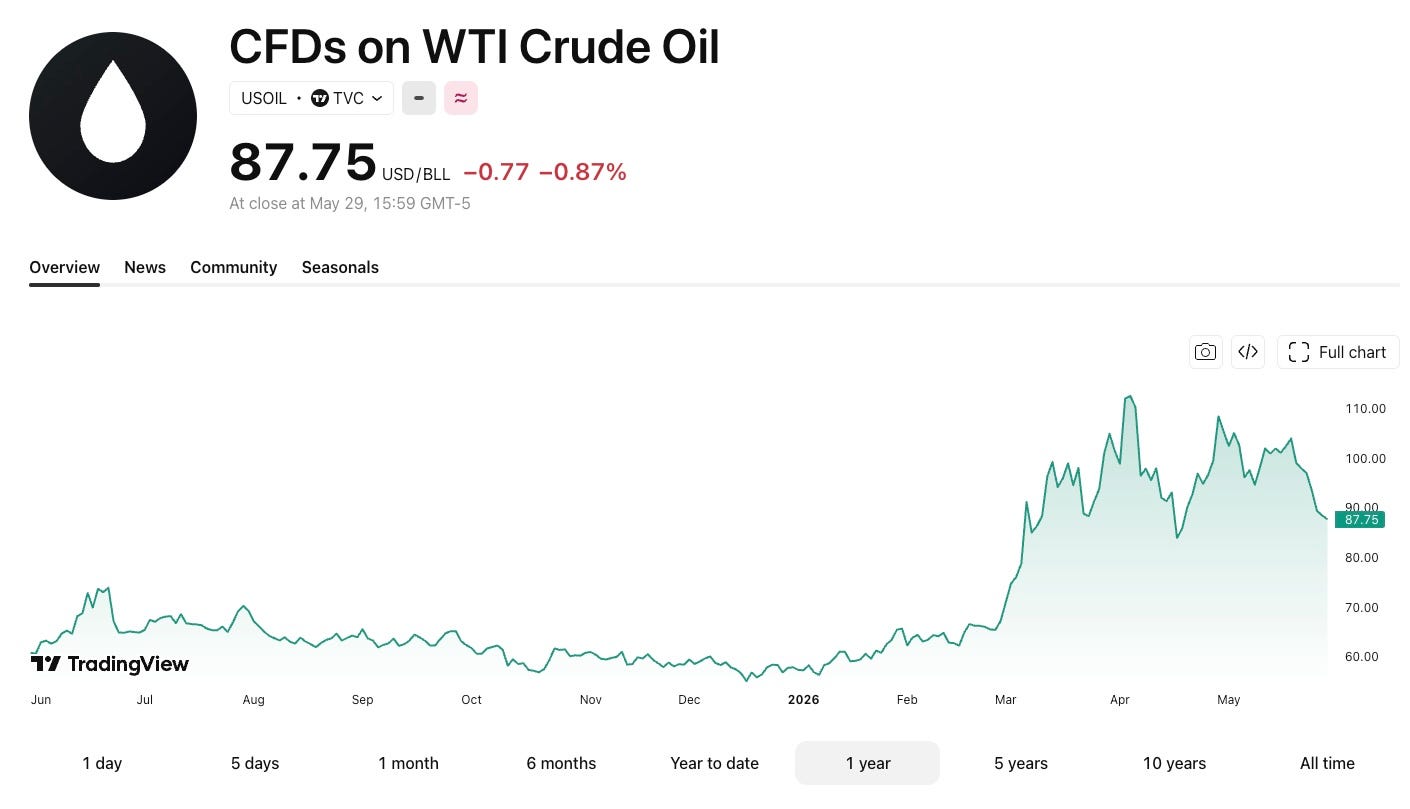
The Iran conflict changed that calculus. U.S. and Israeli strikes on Iranian targets in late February led to the effective closure of the Strait of Hormuz. Goldman Sachs estimates 14.5 million barrels per day were lost from the Persian Gulf — a 57% cut in pre-war regional output. The global oil market swung from a 1.8 million barrel-per-day surplus to a 9.6 million barrel-per-day deficit. Brent crude, which Goldman had forecasted at $60 for 2025, had traded near $100, though most recently below it again, with an embedded war premium of $30 to $50 per barrel.
Critically, Goldman’s analysis suggests even a clean reopening of the Strait would restore only 70% of lost output within three months, with approximately 500,000 barrels per day of permanent production damage from extended well shut downs. This doesn’t look sitting late May like a transient disruption.
For agriculture the implications are direct. Nitrogen fertilizer, DAP, and urea all require natural gas or petroleum feedstocks. Diesel powers field operations and grain transport. Propane drives grain drying. The cost structure of American farming is repricing in real time — not because gold went up, but because oil did.
Enter Copper
While gold retreated under financial pressure, another metal was reaching record highs. Copper touched $6.69 per pound on COMEX in mid-May — up roughly 35% year over year.
Copper is sometimes called “Dr. Copper” for its reputation as a barometer of economic health. Unlike gold, copper has no meaningful monetary or financial-hedging role. Its price is driven almost entirely by industrial demand and physical supply constraints. When copper rises, it generally means the real economy is building things.
The current copper rally is being driven by a convergence of structural forces:
AI infrastructure. The Magnificent Seven technology companies are spending over $700 billion in capital expenditures in 2026. Data centers require enormous quantities of copper wiring, estimated at up to 50,000 metric tons per large facility.
Electrification. Electric vehicles, grid modernization, battery storage systems, and renewable energy installations all consume significantly more copper than their conventional predecessors.
Re-shoring and industrial build-out. The CHIPS Act, the Inflation Reduction Act, and defense spending are generating a domestic capital expenditure cycle in semiconductors, batteries, manufacturing, and grid infrastructure that would not have existed a decade ago.
Morgan Stanley projects a 600,000-metric-ton copper deficit in 2026. JPMorgan estimates 330,000 tons. Even the International Copper Study Group, which revised its outlook more conservatively, acknowledges the structural demand trajectory.
What Copper Tells Us About Agriculture
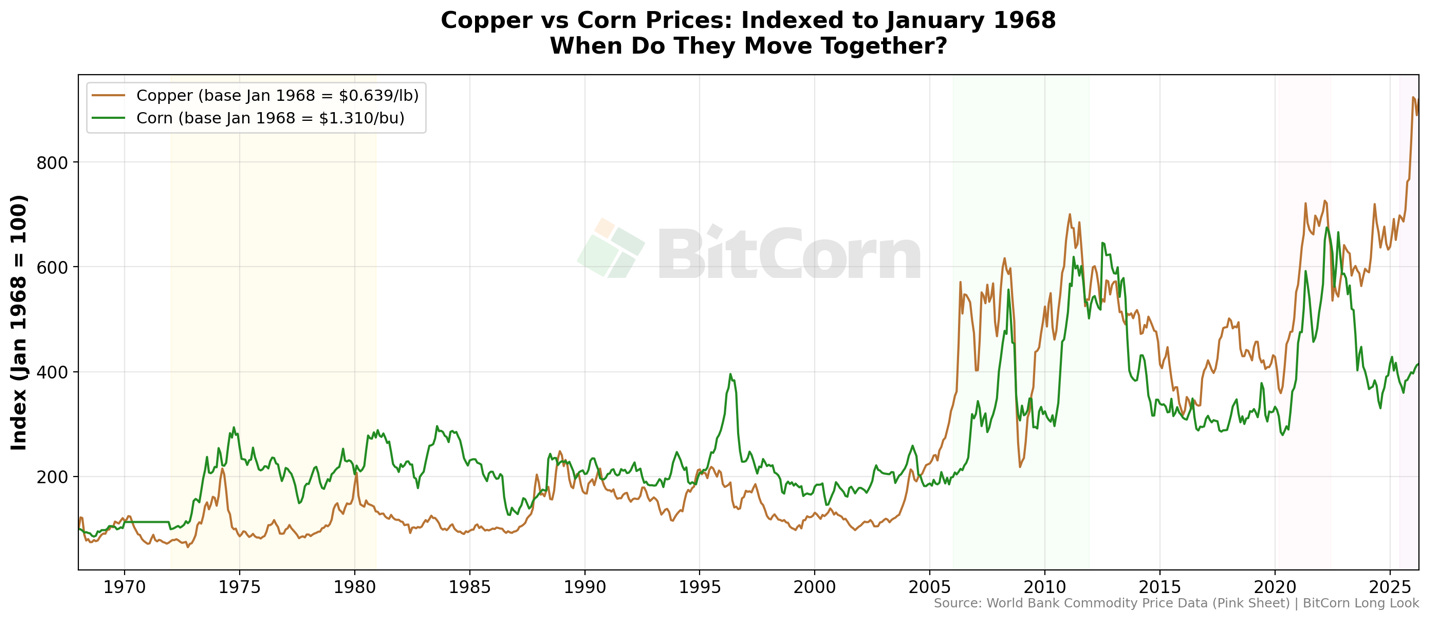
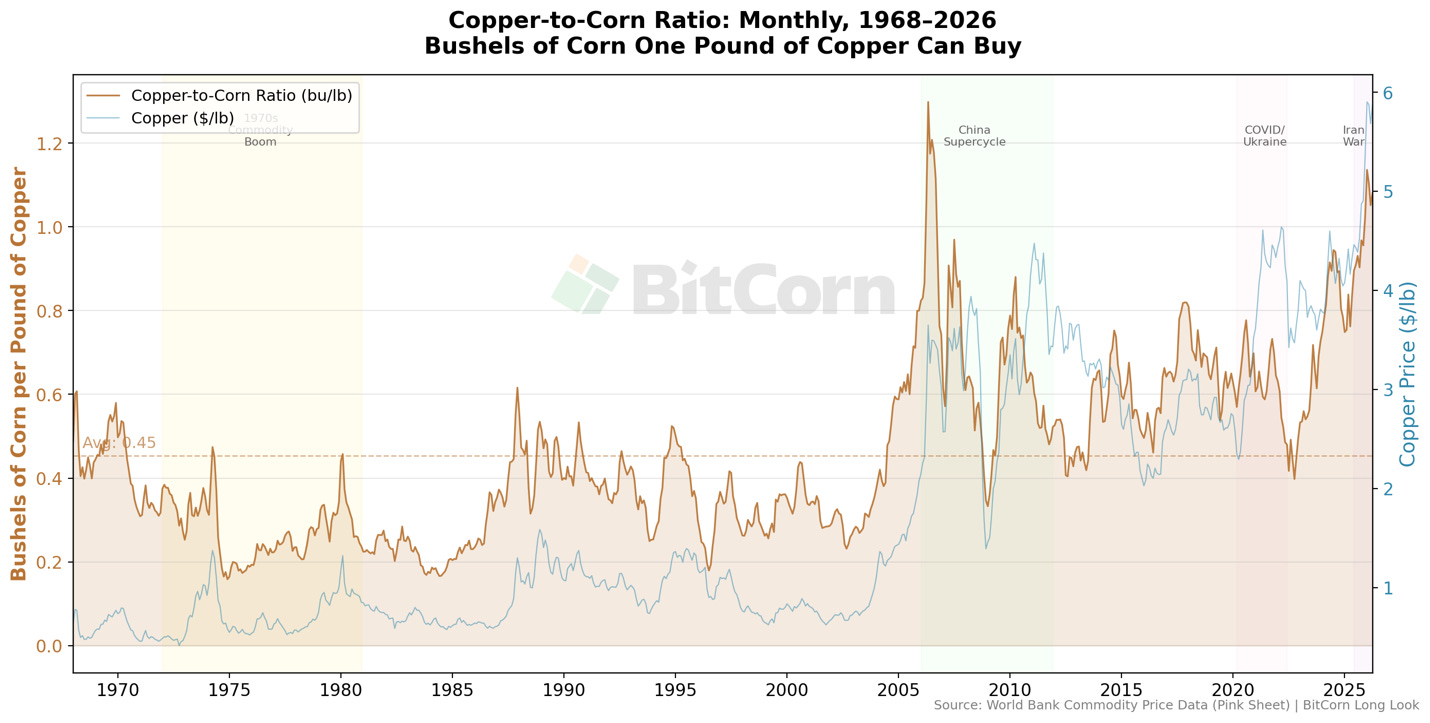
I built a dataset of monthly copper and corn prices from 1968 to the present using World Bank commodity data. The copper-to-corn ratio — how many bushels of corn a pound of copper can purchase — reveals something striking.
The long-run average since 1968 is about 0.45 bushels per pound. Today, it stands at 1.08 — more than double the historical norm, and approaching the all-time high of 1.30 reached during the China-driven commodity supercycle of 2006.
Historically, copper and agricultural commodities have moved together during broad commodity cycles. The 1970s, the 2006–2011 boom, and the post-COVID surge all featured co-movement, driven by common factors: energy shocks, dollar weakness, rapid global demand growth, or supply chain disruptions.
The academic research on cross-commodity spillovers supports this pattern (articles posted at the end if you want a deep dive). Studies find that copper is a net transmitter of price shocks across commodity markets, and that copper-agricultural price connectedness intensifies during crises and commodity supercycles. The primary transmission mechanism is shared energy cost exposure. The secondary channel is global income growth — as economies industrialize and incomes rise, diets shift toward protein, which increases demand for feed grains.
When these channels are active, copper moves first and agriculture follows, sometimes with a lag measured in quarters. When they are dormant — during recessions or demand-driven corrections — copper falls harder and faster than agricultural commodities, which benefit from the inelasticity of food demand.
The current copper-to-corn ratio suggests we may be in the early stages of one of those broad regimes. Copper is pricing in a world of structural industrial demand growth, constrained supply, and rising energy costs. Agriculture has not yet followed to the same degree. The question is whether it will.
The Supercycle Debate
Where there’s a market, there’s a debate.
Jeff Currie, formerly Goldman Sachs’ head of commodity research and now at Carlyle, has called this “the most asymmetric trade in modern financial history.” His thesis rests on three pillars: fifteen years of chronic underinvestment in mining and extraction, a shift from globalized to localized supply chains that tightens competition for scarce resources, and an AI-driven infrastructure boom that demands physical materials at a scale that markets haven’t priced.
Bank of America’s Michael Hartnett frames commodities as “the biggest trade of the next five years,” anchored on deglobalization, underinvestment, and dollar de-dominance.
These are broad commodity arguments. But in recent weeks, the bullish case has narrowed specifically toward agriculture.
LPL Research published a note on May 26, Seeds of Opportunity, arguing that agriculture is “just starting to break out” after energy and metals led the early innings of the commodity cycle. They frame the current moment within the historical pattern of commodity capital cycles — the lost decade of the 2010s giving way to a new structural bull — and point to fertilizer supply constraints from the Strait of Hormuz closure as a catalyst that specifically advantages agricultural prices.
Pro Farmer reported on May 5 that the S&P GSCI Spot Agriculture Index is flashing 100% bullish trend composites across corn, wheat, and soybeans simultaneously — the first time that has occurred since May 2022. Fund positioning is shifting from short to long. The technical case is building alongside the fundamental one.
And then there’s fertilizer. Analyst Amanda Van Dyke argued on May 25 that the fertilizer situation is not a price spike but a systemic supply shock — ammonia and urea up 30 to 40 percent, MAP and DAP up 25 to 50 percent — with the risk that farmers in vulnerable regions simply cannot access inputs in time. If she is right, the impact is not just cost inflation but actual yield reduction.
And weather. Specifically, the El Niño wildcard. Ocean temperatures in certain places are at the highest levels ever recorded. Yeah, climate records only go back to the 1880s. But still. Climate models now project greater than 90% probability of a strong El Niño event forming in 2026, with a potential +1.8°C Pacific anomaly by the fourth quarter. Historically, the yield effects of El Niño lag the climate peak by six to twelve months, which would mean tighter global agricultural supply extending into 2027 and 2028.
And then the skeptics. Lance Roberts at RIA Advisors points to the reflexivity problem: sustained commodity inflation ignites demand destruction. The 2022 oil spike to $130 collapsed within months as consumers and policymakers adjusted. He also notes the dollar contradiction — rising commodity prices tend to strengthen dollar demand through petrodollar recycling, creating a self-limiting ceiling. And there is the consensus-crowding problem: when a trade becomes consensus, the easy returns are behind you.
Both sides acknowledge the supply-side structural case is real. The disagreement is whether it produces a durable multi-year rally or a volatile, ultimately self-correcting spike. The cure for high prices is… high prices.
What is different this time — and what makes the agricultural case worth watching independently from the broader commodity thesis — is the convergence of multiple channels: energy costs transmitting through fertilizer and fuel, tightening stocks-to-use ratios, rising fund interest, and a potential weather shock. Any one of these alone might not move the needle. Together, they create the kind of environment where the base case can shift faster than models predict.
Updated Assessment
Four conditions shaped my January conclusion. Here is where they stand today:
Agricultural supply is ample — Eroding. The May WASDE projects world corn ending stocks at their lowest since 2013/14. Wheat stocks are down 18%. Soybean stocks-to-use ratios have tightened from 8.0% to 6.9%. Breakeven yields for corn are 35–53% above current USDA projections, meaning any weather disappointment creates material downside risk.
Energy is restraining cost pressures — Reversed. This was my strongest argument in January. The Iran conflict has comprehensively overturned it. Brent crude has risen from the mid-$60s to near $100, with structural production damage suggesting some kind of extended increase is durable for a time.
Biofuel demand has matured — Partially shifting. Soybean oil demand for renewable diesel and sustainable aviation fuel is a growing factor in the May WASDE. Not explosive, but more dynamic than January suggested.
Gold’s signal is financial — Confirmed. Gold’s 10% decline during a major geopolitical conflict confirms its signal was monetary, not physical. The repricing pressure is coming from elsewhere.
To quote the great Yogi Berra, it’s tough to make predictions, especially about the future.
But I’ll ease myself out on the proverbial limb. A little ways.
The base case for agricultural repricing is less weak than it was four months ago.
The energy channel is active. Supply cushions are eroding. And my new friend Dr. Copper — the real-economy bellwether — is at record highs, signaling the kind of broad industrial and infrastructure demand that has historically preceded agricultural price strength.
None of this constitutes a prediction. Agricultural markets are still governed by weather, trade policy, and the specific dynamics of stocks-to-use ratios. But the conditions I described in January under which the thesis could break — a shift from financial concern to physical stress, a change in expectations outrunning fundamentals — are closer to materializing than they were four months ago.
The lesson remains the same: In commodity markets, psychology (or psychosis!) can move faster than balance sheets. What’s changed is that the stress is no longer hypothetical. The energy transmission channel is open. The industrial metals complex is signaling real demand. And the question for agriculture has shifted from “Will gold pull corn higher?” to something more grounded: “Will the physical economy do what gold couldn’t?”
I’m thrilled to be a part of the Iowa Startup Collective, a group of writers exploring entrepreneurship. Please check out the Roundup of columns.